
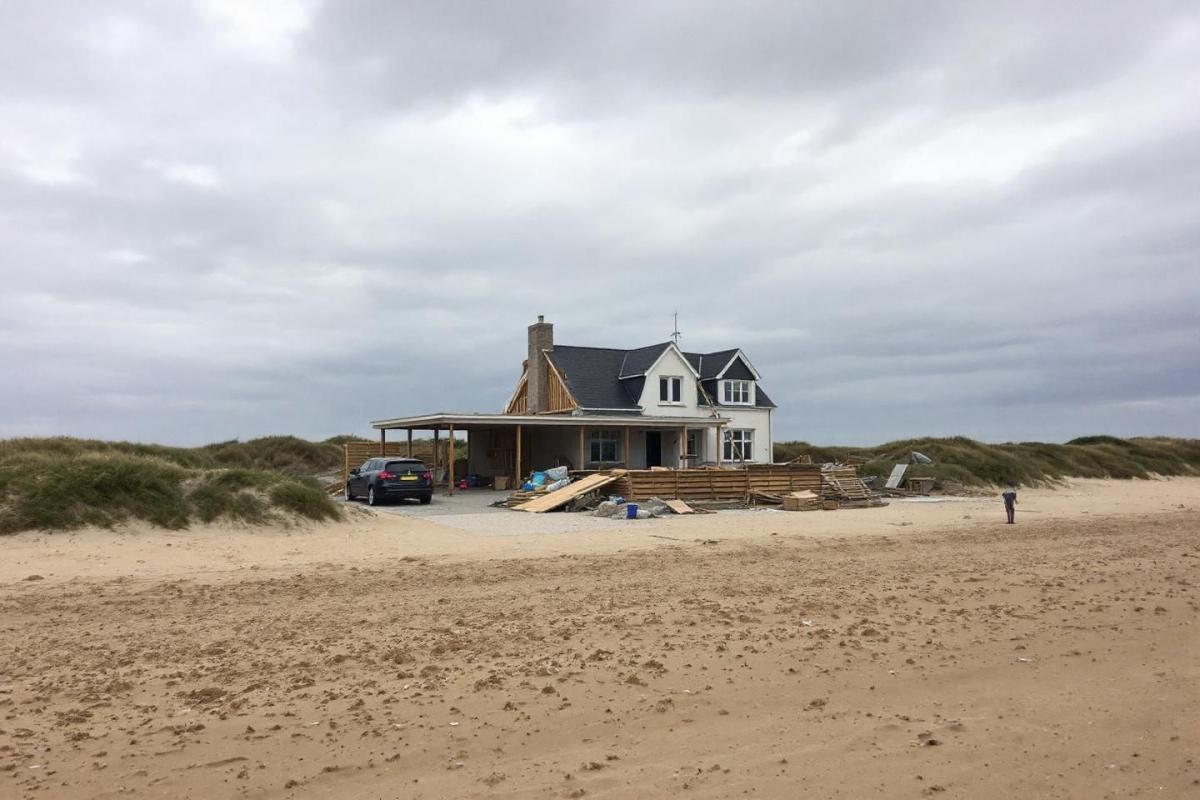
The latest deprivation statistics for England have unveiled a concerning picture of inequality across the nation, with Jaywick in Essex maintaining its position as the country’s most disadvantaged neighbourhood. This coastal community near Clacton-on-Sea has now held this unwelcome distinction for the fourth time since comprehensive measurements began in 2010. The data reveals that persistent poverty patterns continue to plague specific regions, with coastal towns and former industrial areas bearing the heaviest burden of socioeconomic challenges.
Blackpool dominates England’s most disadvantaged neighbourhoods
The Ministry for Housing, Communities and Local Government’s comprehensive analysis reveals that seven areas within Blackpool feature among the ten most deprived neighbourhoods nationwide. This Lancashire seaside town’s overwhelming presence in the statistics highlights the particular struggles facing coastal communities that once thrived on tourism but now grapple with economic decline and limited opportunities.
Alongside Blackpool’s multiple entries, the top ten list includes single neighbourhoods from Hastings and Rotherham, creating a geographical spread that encompasses both seaside towns and former industrial heartlands. These locations share common characteristics : declining traditional industries, limited employment prospects, and infrastructure challenges that compound their residents’ difficulties.
The data demonstrates how economic transformation has left certain communities behind, particularly those that relied heavily on single industries or seasonal tourism. Government minister Alison McGovern described these findings as a damning indictment of previous policies, emphasising that earlier approaches had barely begun to address the underlying causes of neighbourhood decline.
Regional distribution reveals stark deprivation patterns
Geographic analysis of the deprivation data shows that disadvantaged areas are concentrated primarily in northern England and the Midlands. More than one in five neighbourhoods in the North East and North West fall into the most deprived category, creating a stark contrast with southern regions where only one in 25 neighbourhoods face similar challenges in London, the South West, and East England.
The South East performs even better, with merely one in 33 neighbourhoods classified as highly deprived. This regional divide reflects decades of economic policy that has favoured London and the South East while traditional industrial areas have struggled to adapt to post-industrial economic realities.
| Region | Proportion of Most Deprived Areas |
|---|---|
| North East | 1 in 5 |
| North West | 1 in 5 |
| London | 1 in 25 |
| South West | 1 in 25 |
| East England | 1 in 25 |
| South East | 1 in 33 |
Middlesbrough emerges as particularly concerning, with half of its neighbourhoods classified as very deprived, giving it the highest proportion among all local authorities. This exceeds even Birmingham and Hartlepool, despite those areas also facing significant challenges. The consistency of deprivation within Middlesbrough suggests systemic issues that require comprehensive intervention strategies.
Specialised deprivation categories reveal complex challenges
The Index of Multiple Deprivation examines various aspects of disadvantage, revealing that different areas struggle with specific types of hardship. Tower Hamlets and Hackney in London show the highest levels of income deprivation among families with children, while nine of the ten local authorities with the greatest income deprivation among elderly residents are located within the capital.
This complexity demonstrates that deprivation takes many forms across England’s diverse communities. Liverpool, despite dropping from second place overall since 2019, still records the worst health outcomes, with more than 60% of its neighbourhoods experiencing significant health-related challenges.
The measurement criteria encompass multiple factors that determine neighbourhood quality of life :
- Income levels and employment opportunities
- Educational attainment and skills development
- Crime rates and community safety
- Health outcomes and disability prevalence
- Housing accessibility and service barriers
- Environmental quality and living conditions
These comprehensive metrics ensure that the deprivation index captures the full spectrum of challenges facing England’s most disadvantaged communities, providing policymakers with detailed information for targeted interventions.
Government response and future investment strategies
The current government has acknowledged these statistics as evidence of systemic failures in previous approaches to addressing deprivation. Minister McGovern announced that the administration is implementing comprehensive measures to tackle root causes rather than symptoms, including £500 million investment in children’s development and extended free school meal programmes.
A new £1 billion crisis support package across the UK represents part of this broader strategy, while the recently announced Pride in Place funding offers overlooked communities access to £5 billion in targeted resources. These initiatives partly rely on the 2019 deprivation figures for allocation decisions, highlighting the practical importance of this data for resource distribution.
Jaywick itself benefits from a £126 million, 20-year improvement plan agreed by Tendring District Council, demonstrating local commitment to transformation. However, local MP Nigel Farage acknowledges the limitations of individual efforts, stating there are constraints on what one person can achieve despite his attempts to raise the area’s profile.
Dr Megan Armstrong from University College London emphasises that breaking cycles of deprivation requires sustained investment, structural reform, and genuine community engagement. She argues that working-class communities in former industrial areas have borne the consequences of deindustrialisation without adequate support or alternatives, creating entrenched disadvantage that demands comprehensive governmental response.

- UK wood electricity generation hits record high, Drax data reveals - October 18, 2026
- UK wood electricity generation hits record high, Drax data reveals - October 18, 2026
- England league-union hybrid match proposed for 2026 - October 16, 2026

